
See the cost problem
while you can still fix it.
Ibeks turns timesheets, dockets, purchase orders and site diaries into a live forecast of where every project — and your whole portfolio — will land. Catch cost movement weeks before the month-end pack.
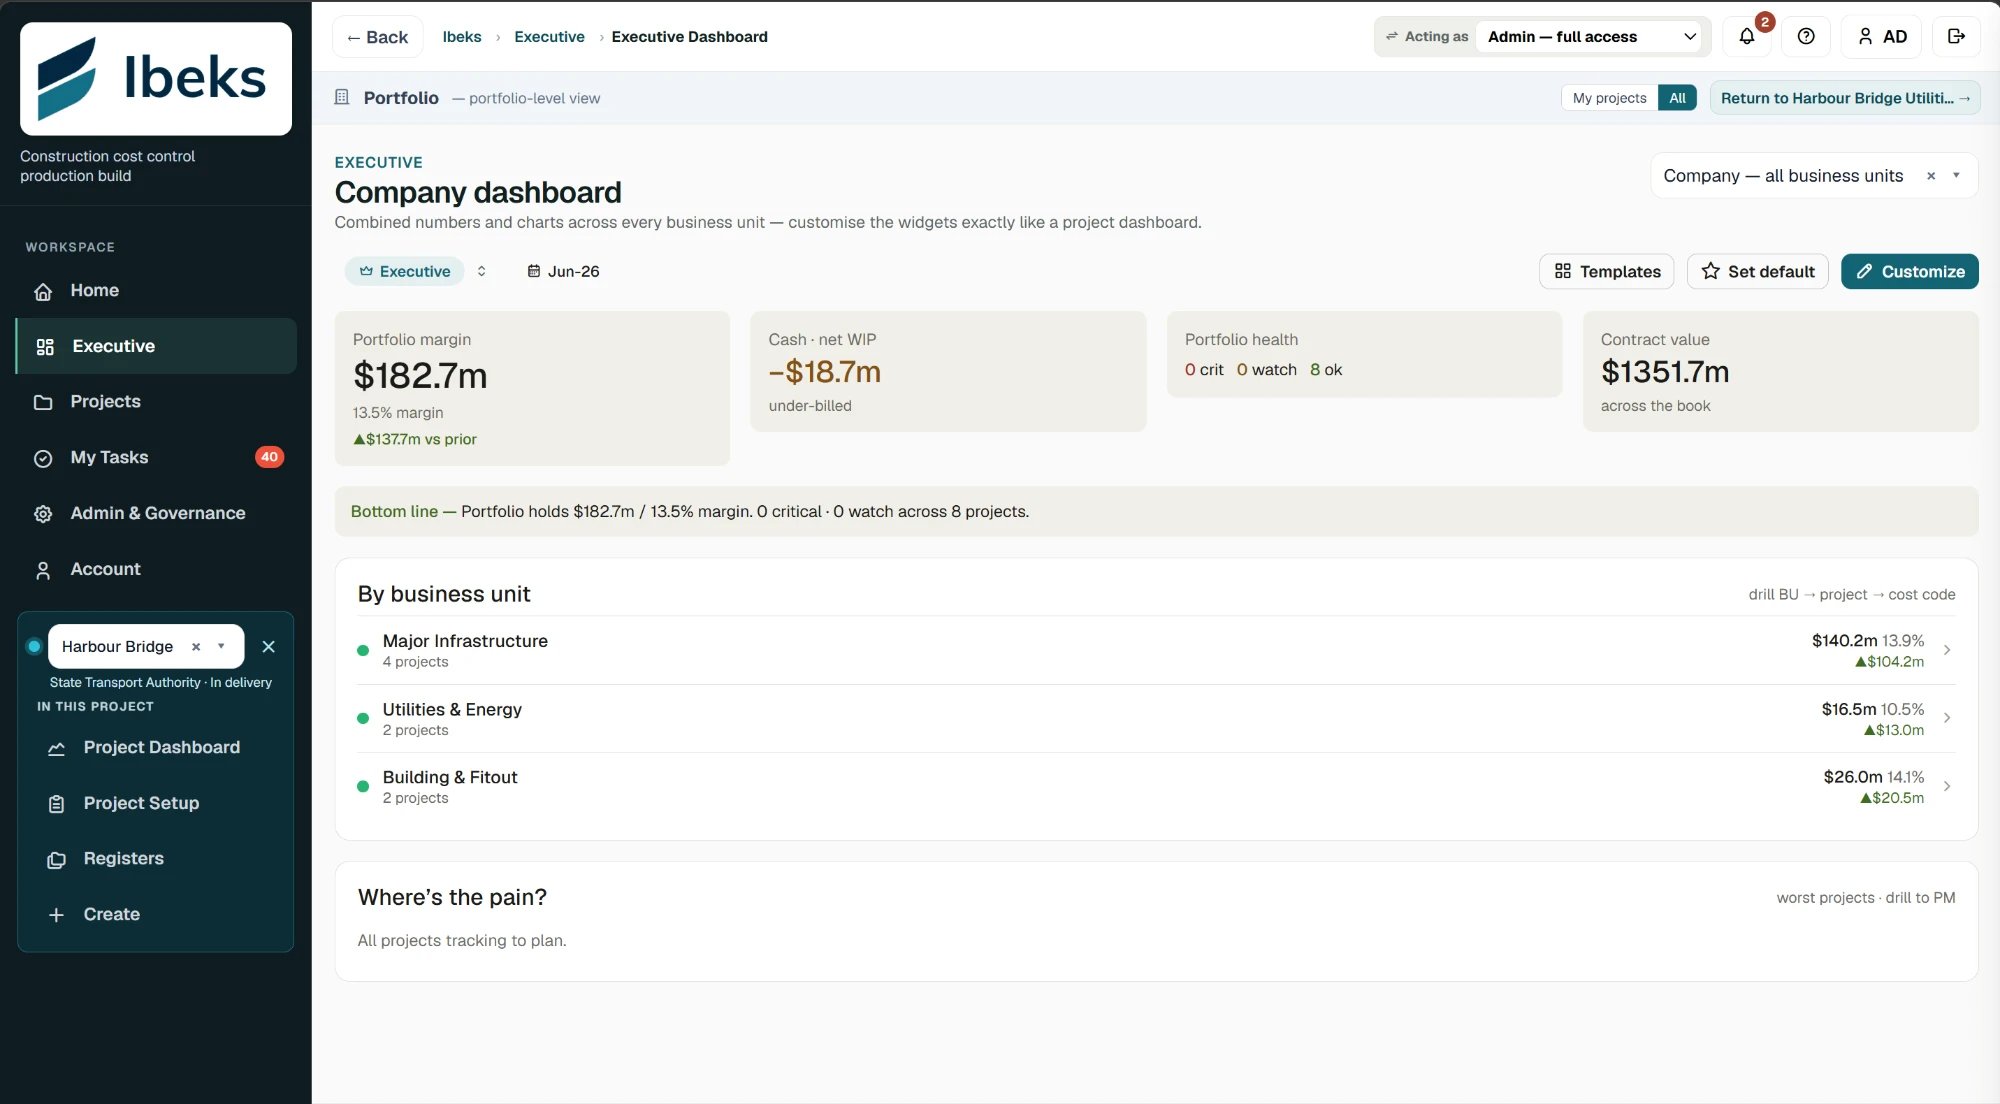
Overruns aren’t the exception. They’re the average.
Sources: Grattan Institute; Master Builders Australia; Love & Edwards, Curtin University.
The industry doesn’t lose money because the work is hard. It loses money because the numbers arrive too late to act on. By the time a month-end pack shows the overrun, the cost is already committed. Ibeks closes that gap.
From site activity to final cost — live.
One platform that runs the whole loop: capture cost at source, forecast the landing, control the spend, and give every role its own view.
Cost at source
Voice diaries, crew timesheets, dockets and POs become structured cost the moment they happen — no re-keying.
The landing, not the history
A live estimate-at-completion on every cost code, rolled to area, project and portfolio — with an early-warning Movement signal.
Before it’s committed
Value gates matched to your delegations of authority, enforced by the system, with a full audit trail of who signed what, when.
A view for every role
Role-based dashboards, an executive view built around margin and cash, and a portal that brings subcontractors into the loop.
Forecast the landing, not the history.
Budget, Committed, Actual and estimate-at-completion on every cost code, always current. You see the trend at month 2 — not in the month‑8 pack.
- Movement signal flags the project that’s turning, this month vs last
- Risk & opportunity baked into a risk-adjusted forecast
- Full cost-to-complete worksheets for the QS, one click for everyone else
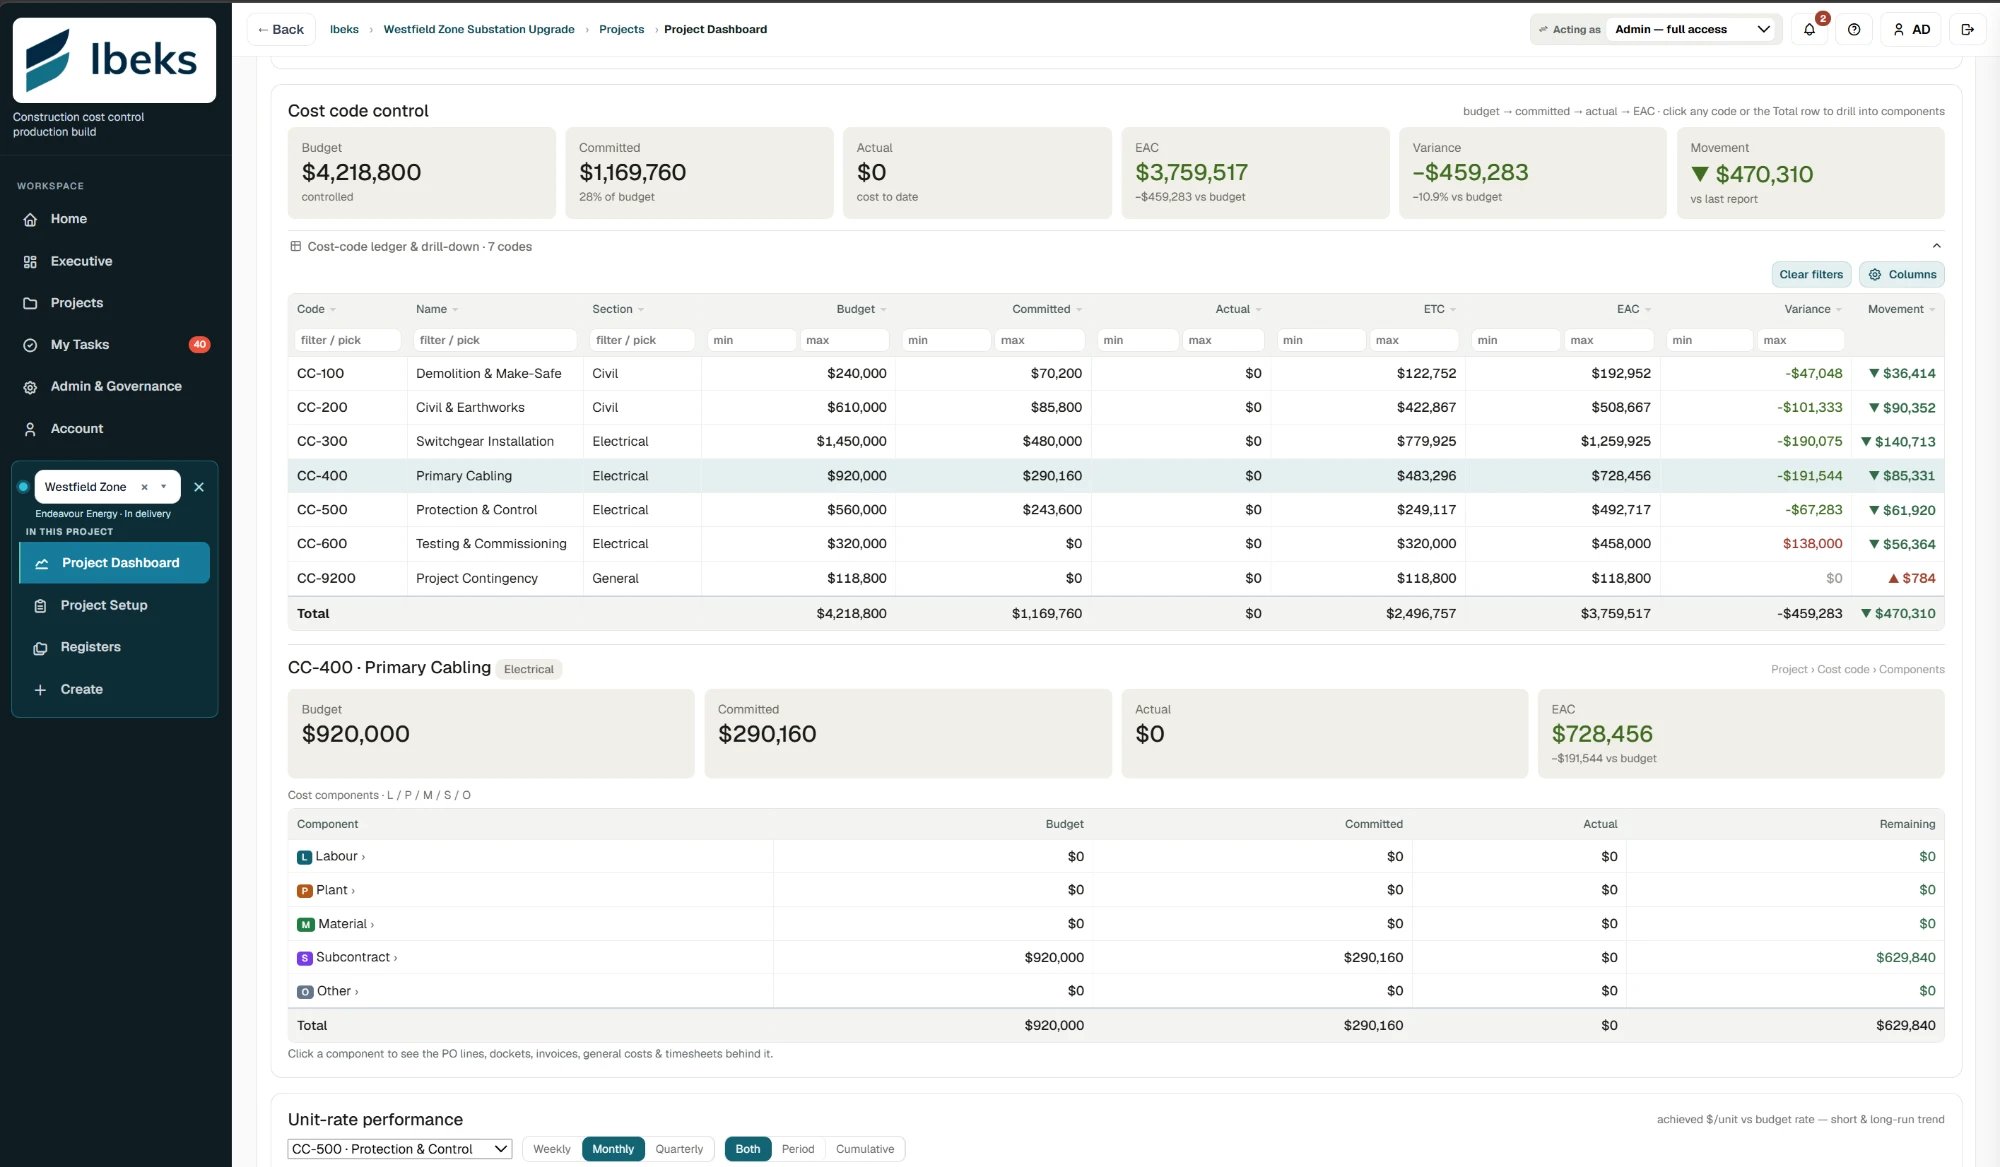
Capture cost at source. Kill the data lag.
A supervisor speaks their site diary; an engineer confirms it into structured progress the same day. Crew timesheets run one sheet per crew per day — the way foremen already record labour.
- Crew timesheets with a grade, override and overtime rate engine
- PO line items allocated across cost codes, validated to 100%
- Dockets, general costs and progress captured as they happen
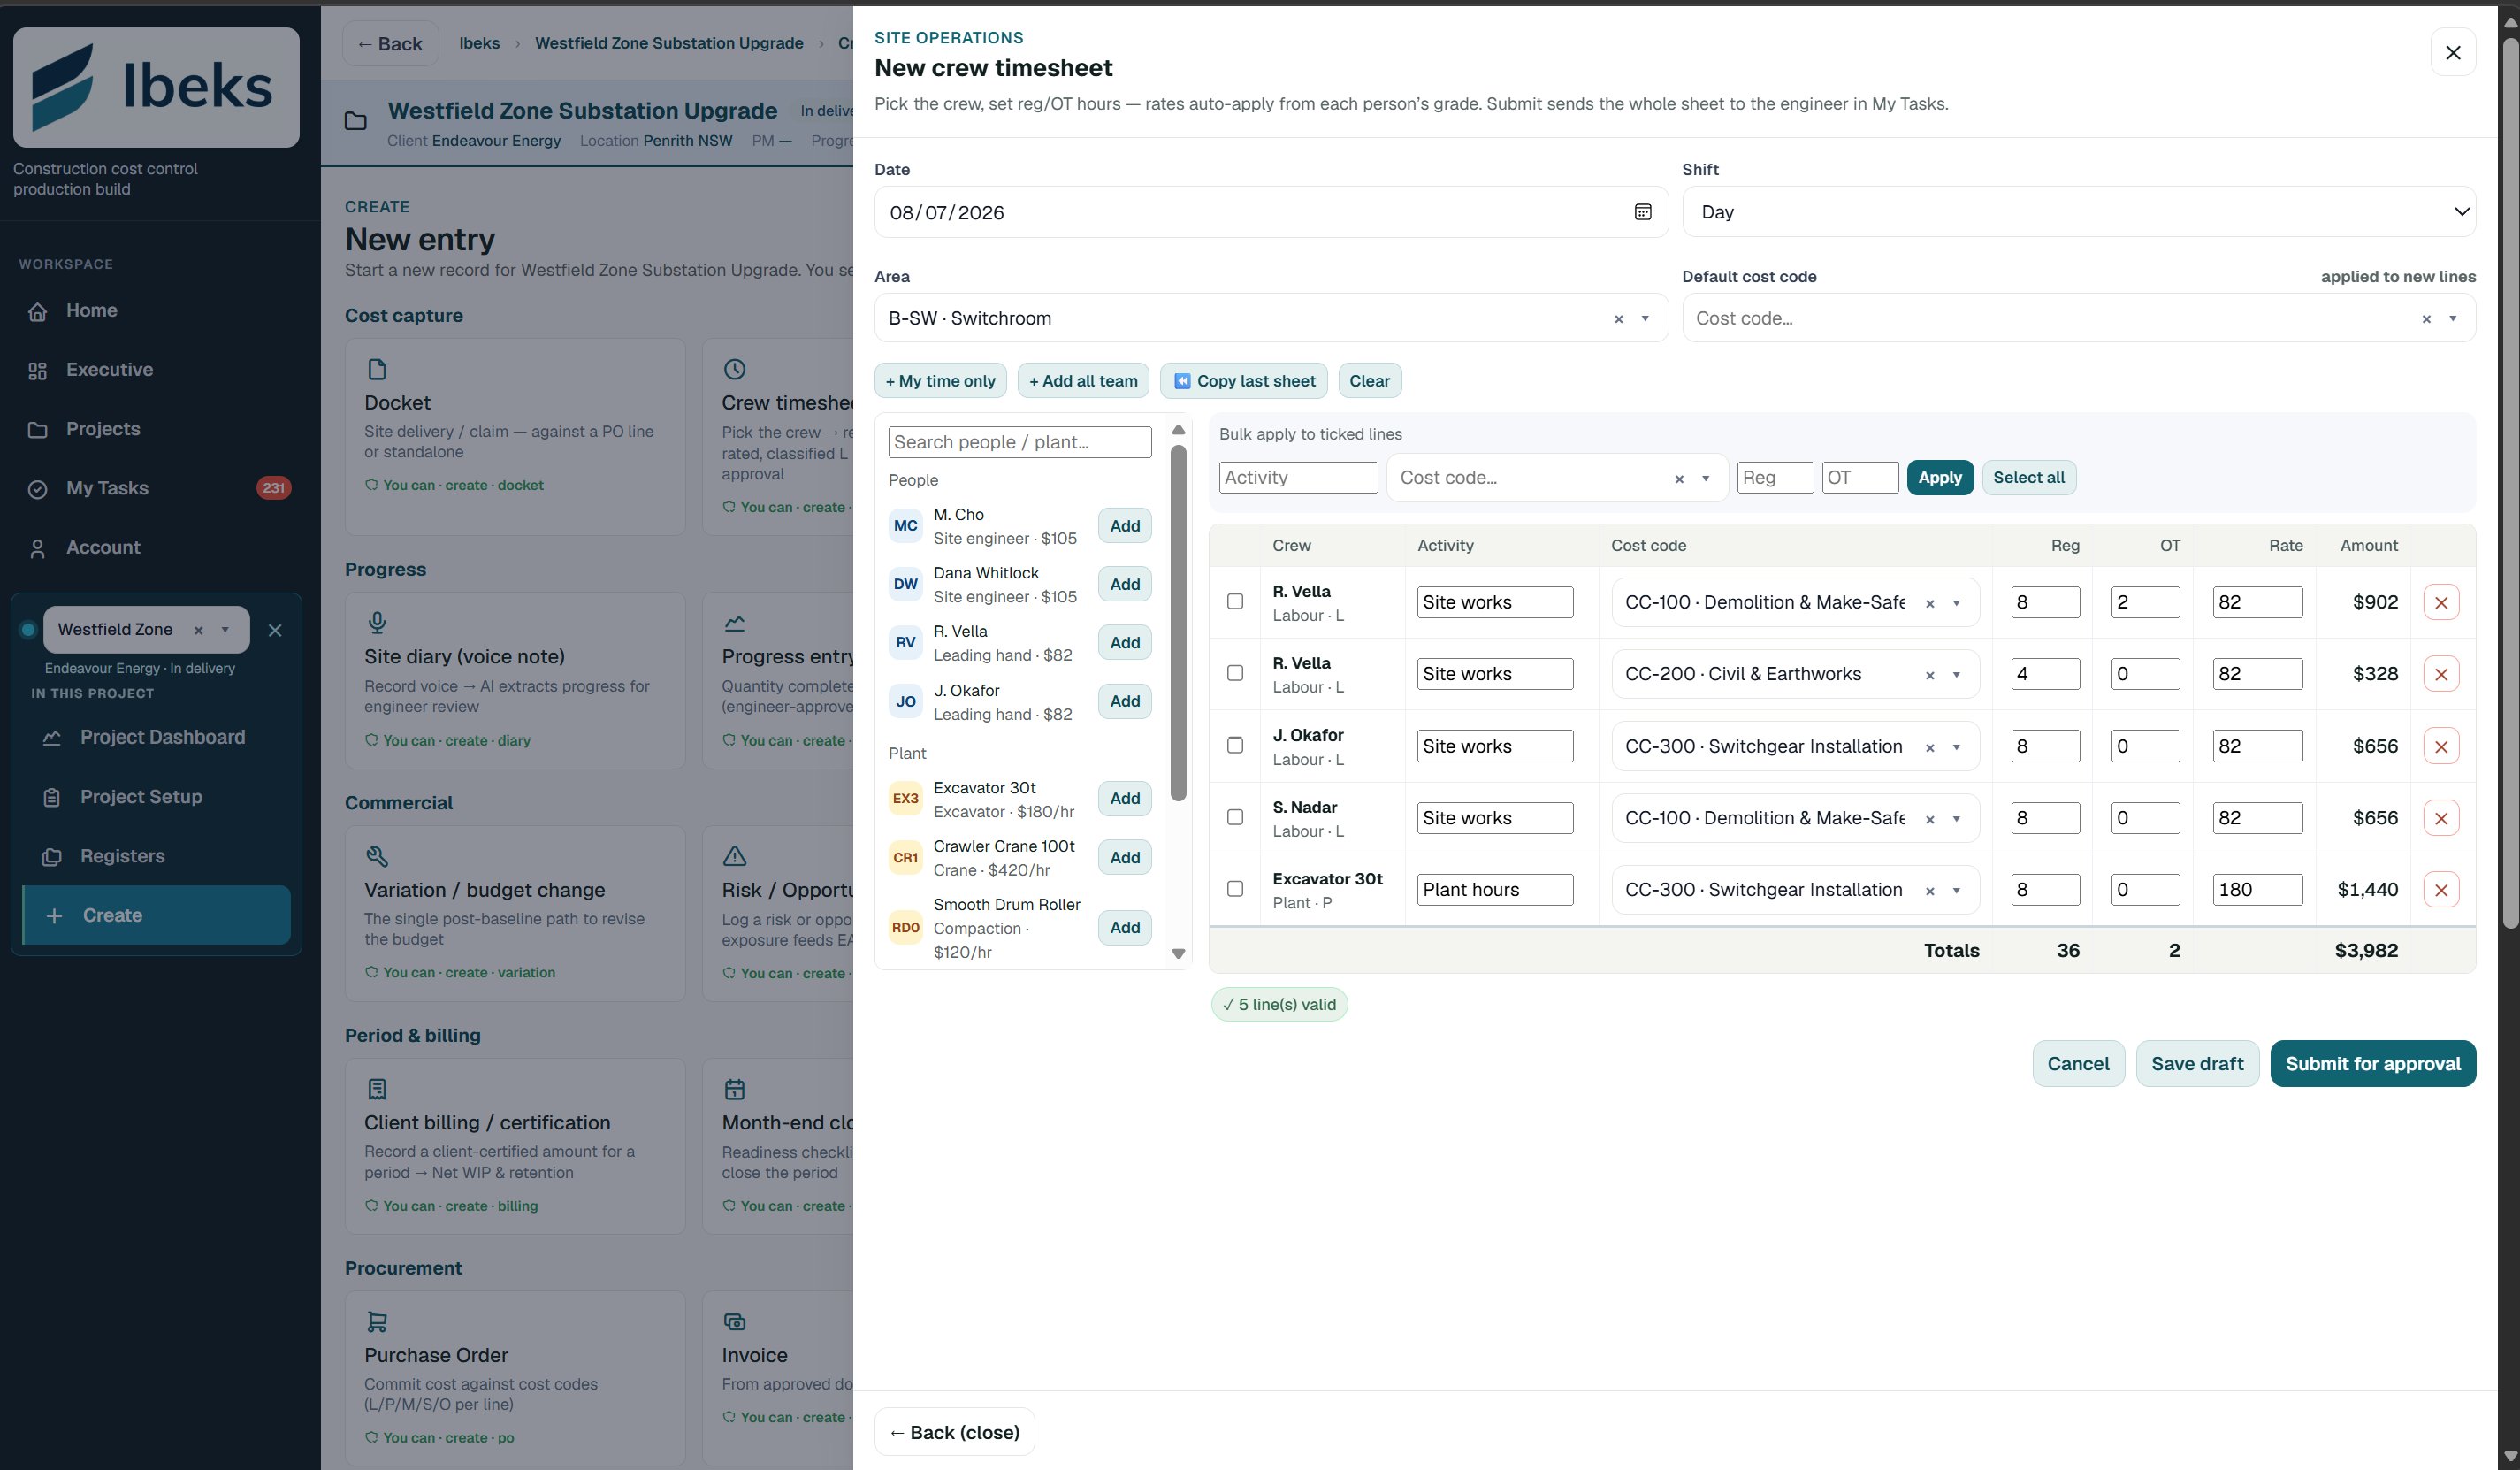
The money can’t move until the right person says yes.
A visual workflow engine with value gates matched to your delegations of authority — enforced by the system, not by habit. Every approval lands in one My Tasks queue.
- Delegation matrix and enforced approval paths
- Variations flow into budget and forecast without double counting
- Retention tracking, PO close-out, and a complete audit log
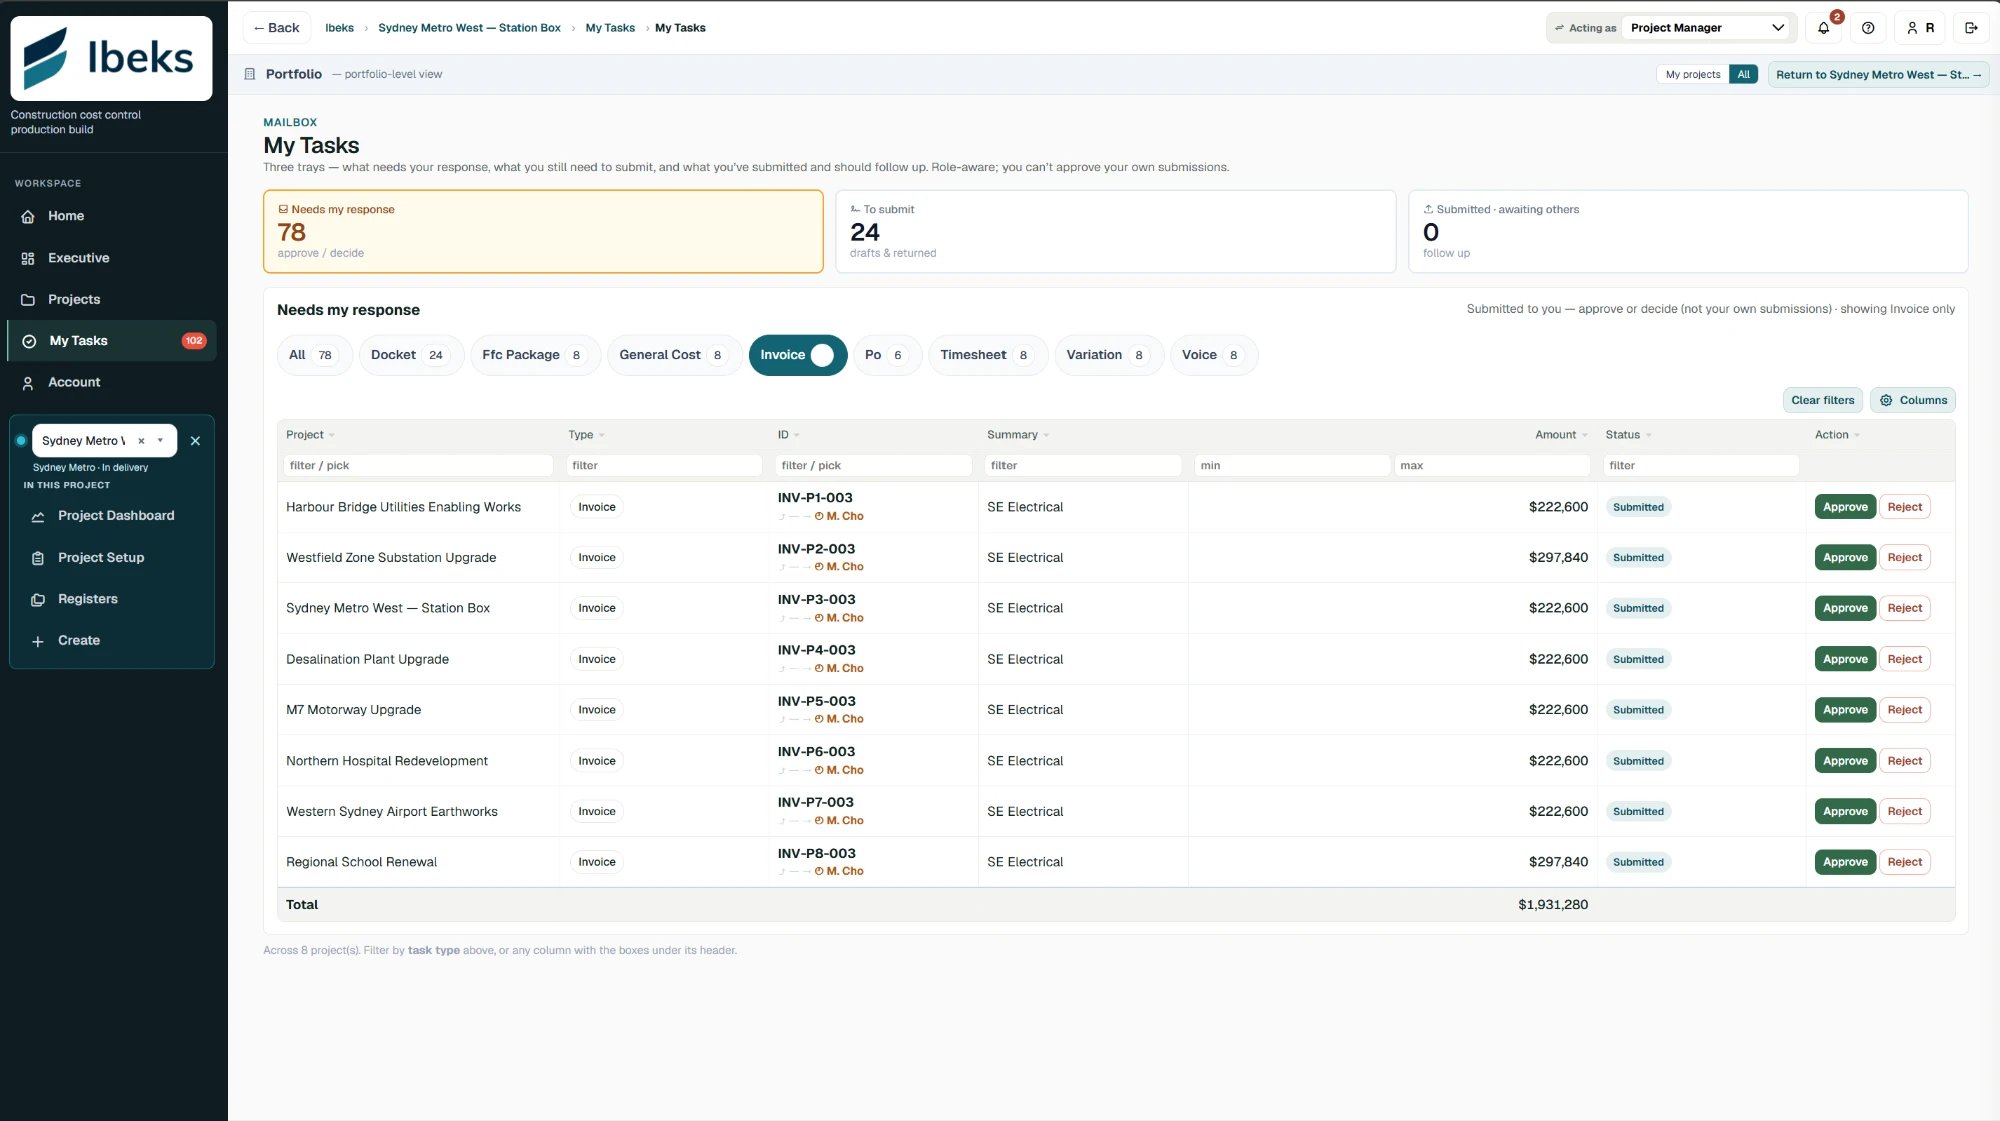
Everyone sees their job — from the board to the subbie.
Role-based dashboards with a drag-and-drop widget builder. The board sees margin and cash; the QS sees their cost codes; the subcontractor sees only theirs, in their own scoped portal.
- Executive view scoped to the two questions leadership asks: margin and cash
- Click any number and drill to the evidence behind it — POs, invoices, dockets, timesheets
- Subcontractor portal with scoped team management
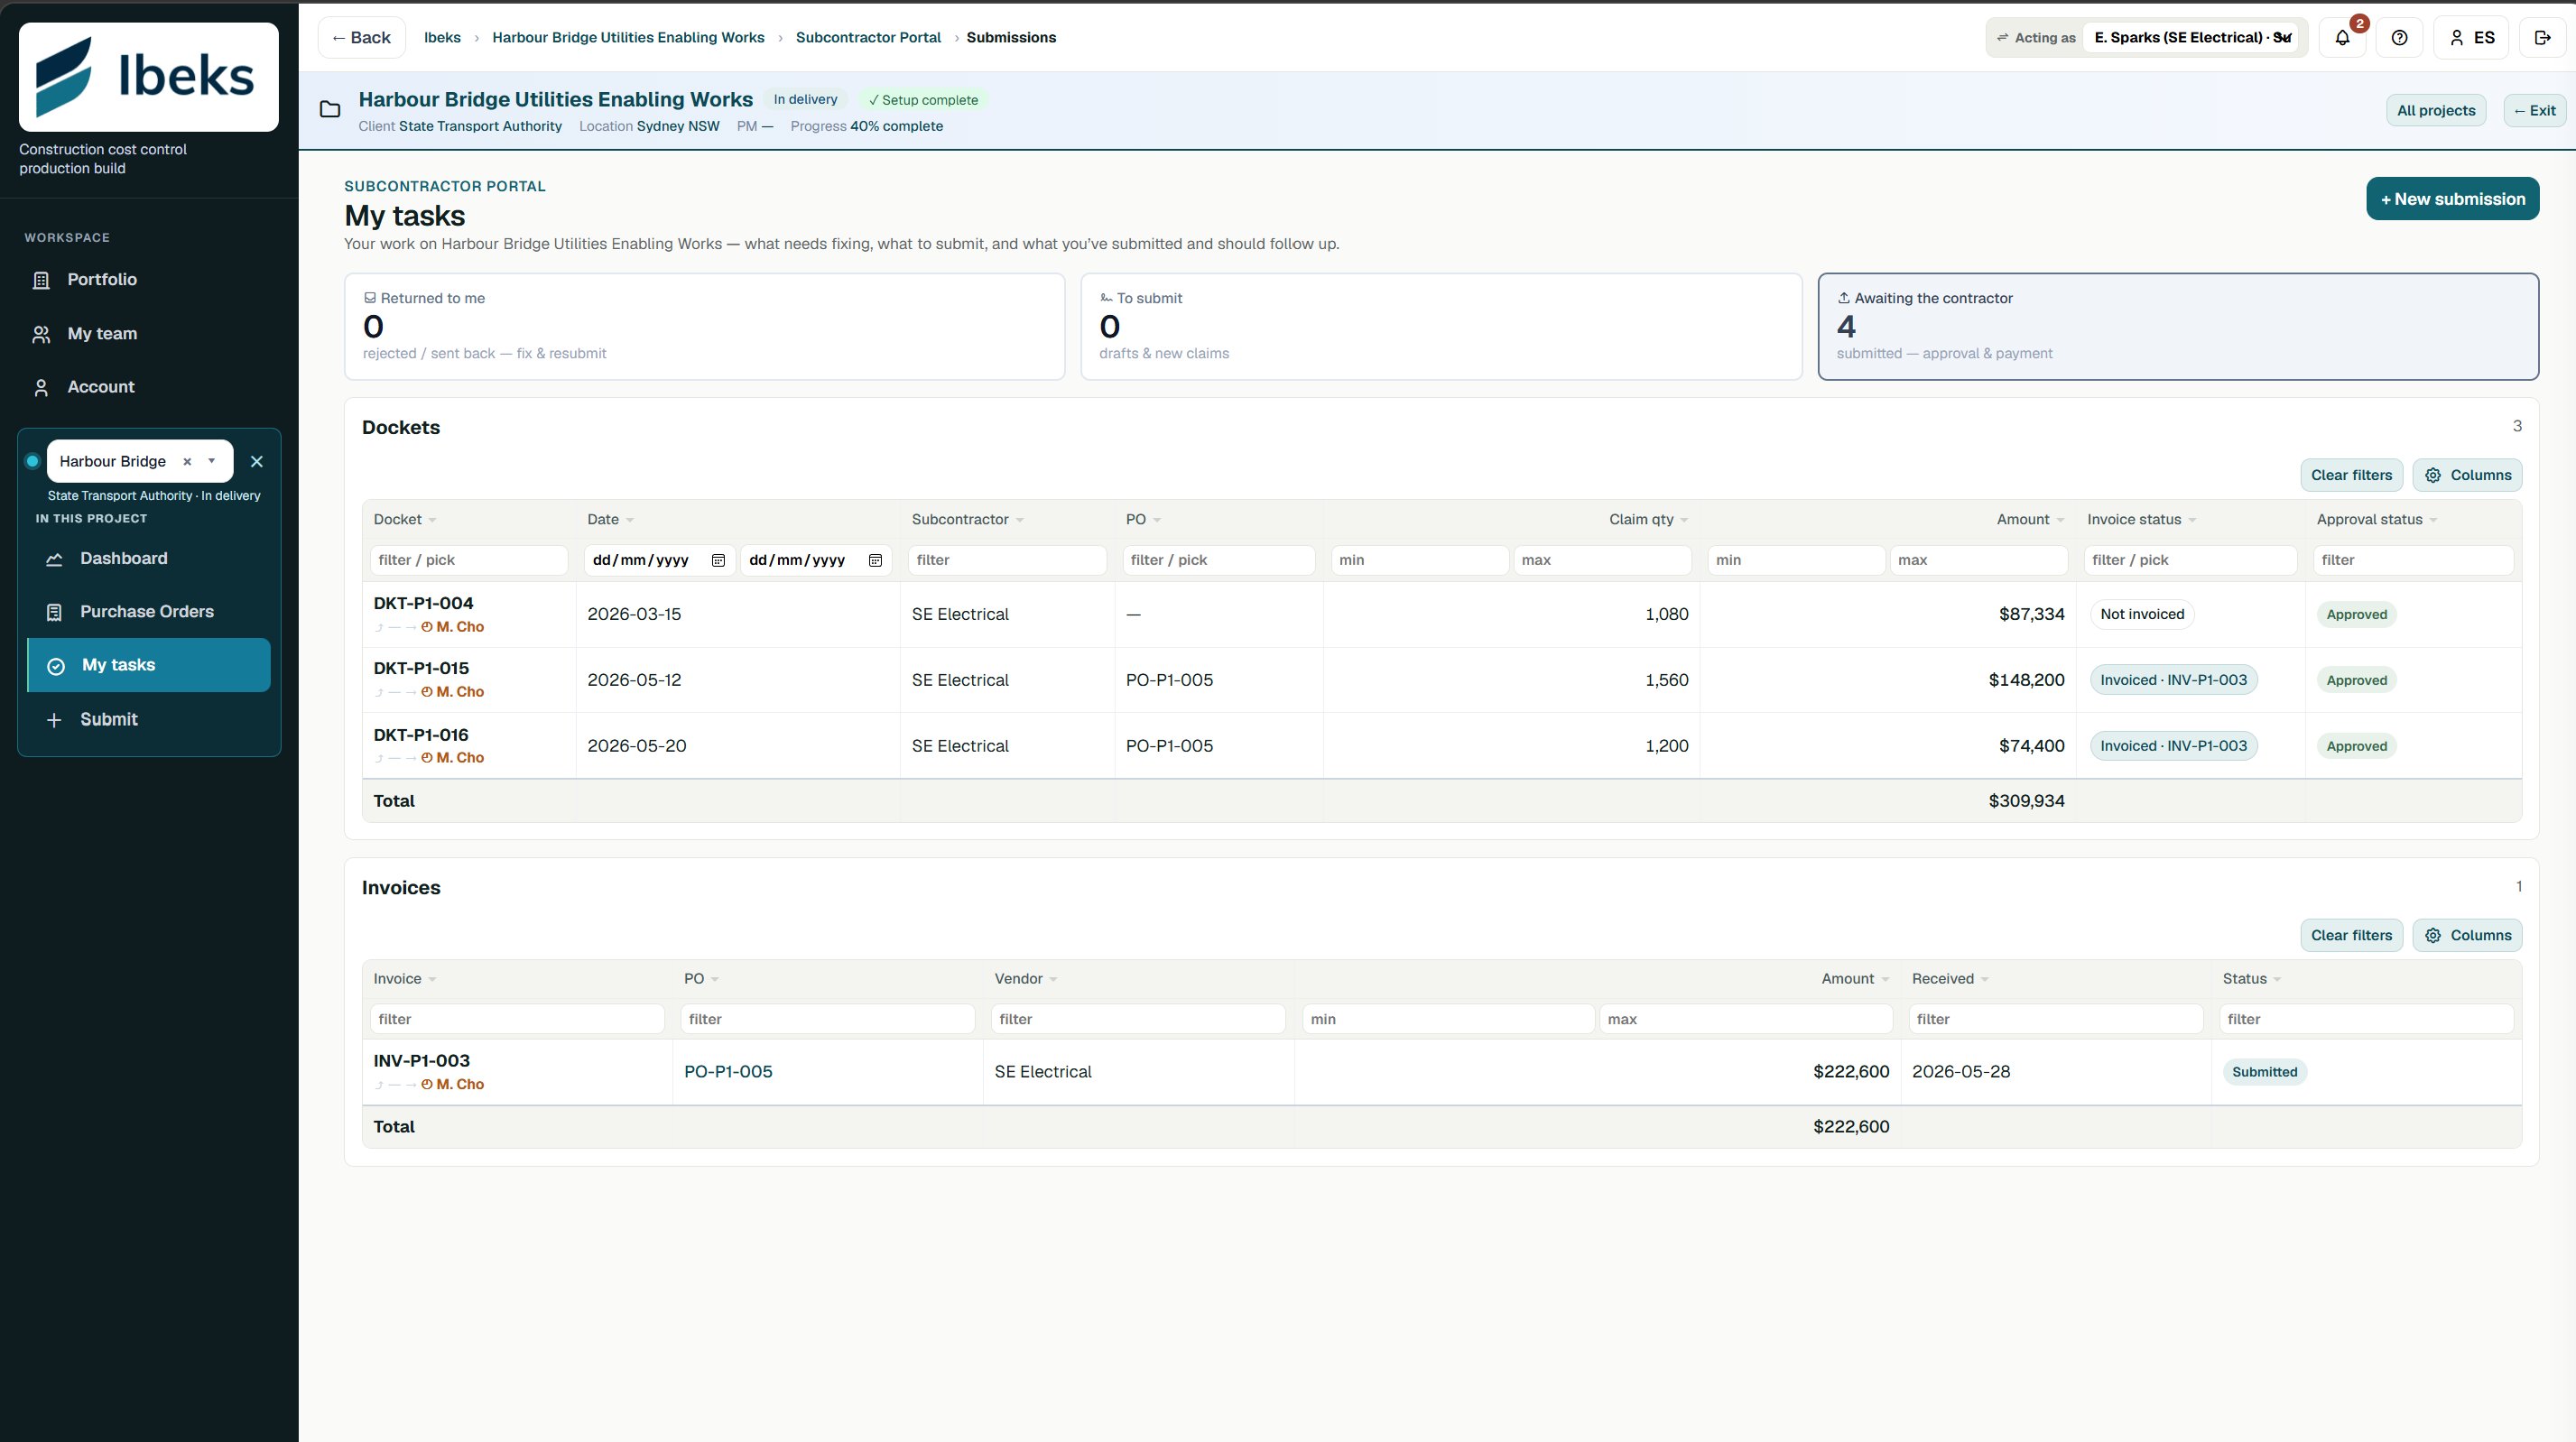
Built for the whole commercial chain.
Live portfolio forecast and margin — the bad news arrives while it’s still fixable.
The forecast builds itself from site data. Your time goes on decisions, not consolidation.
Movement flags the project that’s turning weeks before it shows in the month-end pack.
Nothing gets committed until the right person signs — and the record proves it.
Speak your diary; an engineer confirms it into structured cost the same day.
Ibeks targets a 0.5–2% reduction in delivered project cost — which on typical margins is roughly 10–38% more project profit, plus a one-off cash-flow gain from collecting retention when it falls due.
Illustrative, at a 5% net margin: on a A$50m project, 0.5–2% of delivered cost is roughly A$238k–A$950k. We don’t promise a fixed number — savings depend on adoption and acting early. Run your own portfolio through the calculator.
Run your numbers| Reduction in delivered cost | Uplift in project profit* |
|---|---|
| 0.5% | ~10% more profit |
| 1.0% | ~19% more profit |
| 2.0% | ~38% more profit |
*At a typical ~5% net margin. All figures AUD. All published figures sit inside the 0.5–2% band — we never quote above it.
What we won’t promise.
Ibeks protects the margin inside your contract value by making the cost problem visible earlier. That claim is worth more when you know what we won’t say.
No guaranteed percentage
Savings depend on adoption and on acting early. We publish a target band — 0.5–2% off delivered cost — and hand you the model to run your own numbers.
No invented case studies
Anything unproven is labelled illustrative. The market statistics we do quote are sourced — Grattan Institute, Master Builders Australia, Curtin University.
No revenue promises
We don’t claim to win you work or change your contract value. Ibeks catches cost movement earlier — it protects the thin slice of margin inside the jobs you already have.
One project. Live forecast within weeks.
No rip-and-replace. Ibeks runs alongside what you already have and replaces the spreadsheet-and-month-end-pack cycle — not your systems.
Import your cost codes
We bring in your existing cost-code structure as-is. Your language, your breakdown — nothing to relearn.
Switch on capture
Timesheets, dockets, POs and diaries your site teams already produce start flowing in as structured cost.
Watch the forecast go live
The aim is a live outturn forecast on your pilot project within weeks — then roll out at your own pace.
Where it goes next.
The roadmap builds on structured, sourced cost data — so when the AI arrives, it has real numbers to work with. None of these are live today, and we won’t pretend otherwise.
Integrations & mobile
Xero / MYOB integration, mobile capture, and an email inbox for dockets and invoices.
Voice to cost & auto-narrative
Speak the site diary and AI files structured progress to the right cost code; reports write their own “what changed and why”, with anomaly flags on unusual spend.
Ask your portfolio
Plain-language questions — “why is this project over?” — answered from live data, with the drivers behind every number.
Predictive outturn
AI predicts where each job will land and flags the ones turning before the numbers move.
Roadmap items are planned capabilities, not current features. Timing may change.
Built in Australia, for Australian construction.
Designed around the way Australian sites and commercial teams actually work — delegations of authority, retention, subcontractor claims — with every figure in AUD. A secure cloud service, accessible anywhere, with a full audit trail from day one.

Worth 15 minutes?
Tell us a little about your portfolio and we’ll come back with a walkthrough built around a project like yours — and the savings model so you can run your own numbers.
Prefer to start alone? Run your numbers in the calculator or request access to the platform.